Overview
pcir is an R package developed to assist researchers and practitioners in calculating, comparing, and visualizing the Potential for Conflict Index (PCI) among stakeholders. PCI is a descriptive statistical method designed to enhance the understanding of outcomes in human dimensions research (Manfredo et al. 2003; Vaske et al. 2010).
The concepts of consensus, disagreement, and conflict are relevant across a wide range of disciplines, including economics, political science, psychology, sociology, and natural resource management. Although PCI can be calculated using software such as Excel, SPSS, and SAS, no dedicated R package existed for this analysis — until now.
This package was developed as part of my training in the rOpenSci Champions Program, supported by the Chan Zuckerberg Initiative.
Additional information:
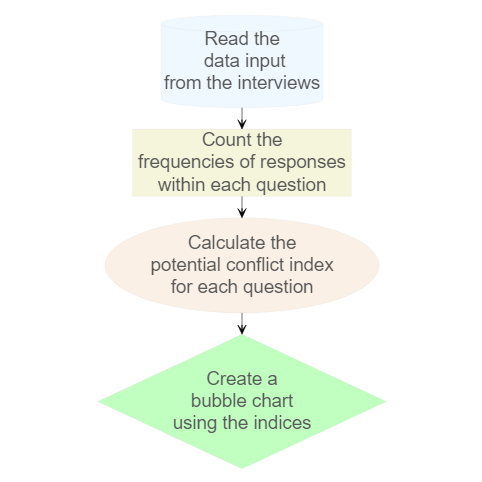
Workflow
Steps implemented in the ‘pcir’ package:
Read the input data from interviews – see example dataset (Spreadsheet);
Count the frequency of responses for each question – see (Table 1);
Calculate the PCI for each question – see (Table 2);
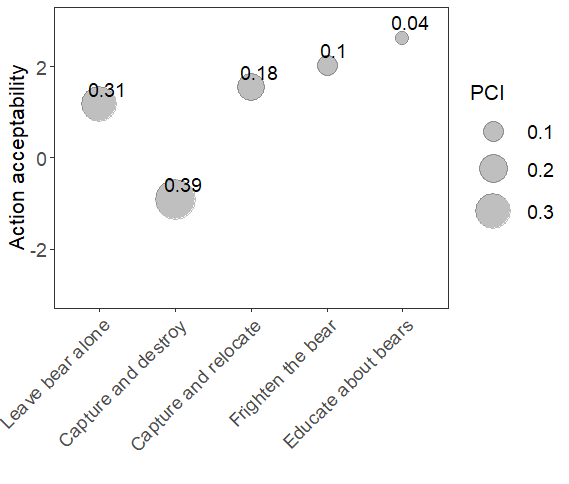
Generate a bubble chart to visualize the results – see (Figure).

Figure 2. Workflow of the pcir package.
Features
counting(): Summarizes data by calculating counts, percentages, means, and standard deviations.pci(): Computes the Potential for Conflict Index from summary data.bubble(): Visualizes PCI results using a bubble plot.
Installation
Install the development version of pcir directly from GitHub:
# Uncomment the line below if devtools is not installed
# install.packages("devtools")

devtools::install_github("fblpalmeira/pcir")
Usage
After installation, load the package:
Example dataset:
df1 <- data.frame(
  A = c(-1, -1, -1, 0, -1),
  B = c(-1, 1, 0, -1, 1),
  C = c(0, 0, 1, 0, -1),
  D = c(0, -1, 1, 1, 1),
  E = c(1, 1, 0, -1, -1)
)
Count responses:
Calculate PCI:
data <- pci(data,
                 scale_type = 'bipolar_with_neutral',
                 min_scale_value = -1,
                 max_scale_value = 1)
Visualize with a bubble plot:
# The bubble function creates a bubble plot to visualize the PCI results.
# You can customize the colors and title as per your preferences.
plot <- bubble(data = df3,
               scale_type = 'bipolar_with_neutral',
               ylim_range = 3,
               bubble_color = 'lightblue',
               bubble_stroke = 'darkblue',
               title = 'Custom Bubble Colors')
plot
Figure 3. Bubble chart illustrating the Potential for Conflict Indices.
References
Manfredo, M., Vaske, J., Teel, T. (2003). The potential for conflict index: A graphic approach to practical significance of human dimensions research. Human Dimensions of Wildlife, 8(3), 219-228.
Vaske, J. J., Beaman, J., Barreto, H., Shelby, L. B. (2010). An extension and further validation of the potential for conflict index. Leisure Sciences, 32(3), 240-254.
Citation
If you use the pcir package in your work, please cite it as follows:
citation(package = 'pcir')Example output:
To cite the 'pcir' package in publications, use:

  Palmeira F, Wundervald B (2025). _pcir: Potential for
  Conflict Index in R_. R package version 0.0.0.9000,
  <https://github.com/fblpalmeira/pcir>.

The BibTeX entry for LaTeX users is

  @Manual{,
    title = {pcir: Potential for Conflict Index in R},
    author = {Francesca Belem Lopes Palmeira and Bruna Wundervald},
    year = {2025},
    note = {R package version 0.0.0.9000},
    url = {https://github.com/fblpalmeira/pcir},
  }
License
This package is licensed under the MIT License file for more details.
Bug Reports
If you encounter any bugs or issues, please report them on the GitHub Issues page.
Note: To report a bug, you need a GitHub account, which you can join for free.
Discussions
The Discussions section is the space for the pcir community to ask questions, share ideas, or get help without opening formal issues.
Contact
For any questions or inquiries, please contact Francesca Palmeira at francesca@alumni.usp.br.

